In Math 6 and Math 6+, students worked with
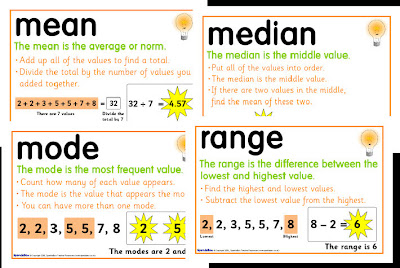
Lesson 8.2: Summarizing Data Using Mean, Median, Mode, and Range. Students used these measures of center and variability to represent different data sets. Discussions were also held about what happens to these measures when new data values are either imported into the data set or removed.
Today´s lesson goal(s):
- Recognize that a measure of center for a numerical data set summarizes all of its values with a single number, while a measure of variation describes how its values vary with a single number.
- Display numerical data in plots on a number line, including dot plots, histograms, and box plots.
No comments:
Post a Comment