Math 6+ students worked with different types of sampling methods that they can use to gather data.
Students also discussed sampling bias and how they can create a surveyor's desired outcome and possibly alter the effectiveness of a sample's results.
Today's lesson objective(s):
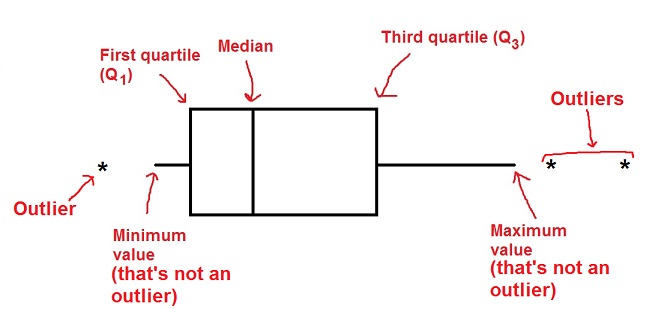
- Display numerical data in plots on a number line, including dot plots, histograms, and box plots.
- Understand that statistics can be used to gain information about a population by examining a sample of the population; generalizations about a population from a sample are valid only if the sample is representative of that population. (7th grade)
- Understand that random sampling tends to produce representative samples and support valid inferences. (7th grade)


No comments:
Post a Comment