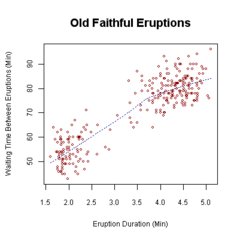
In Math 6+, students worked with scatter plots and looked how much one variable is affected by another. The relationship between two variables is called their correlation.

Today's learning objective(s):
- Recognize a statistical question as one that anticipates variability in the data related to the question and accounts for it in the answers. For example, "How old am I?" is not a statistical question, but "How old are the students in my school?" is a statistical question because one anticipates variability in students' ages.
- Understand that a set of data collected to answer a statistical question has a distribution which can be described by its center, spread, and overall shape.
- Recognize that a measure of center for a numerical data set summarizes all of its values with a single number, while a measure of variation describes how its values vary with a single number.
Summarize and describe distributions.
- Display numerical data in plots on a number line, including dot plots, histograms, and box plots.
- Summarize numerical data sets.
- Give quartile measures of center and variability.
No comments:
Post a Comment