Math 6 and Math 6+ students continued their work with choosing an appropriate statistical measure for a data set. We had to determine the most appropriate measure of central tendency and measure of variability for a data set based on carefully analyzing the values collected from the population being surveyed.
Skills that were introduced, modeled, practiced, and informally/formally assessed today in class include:
Skills that were introduced, modeled, practiced, and informally/formally assessed today in class include:
Math 6 and Math 6+:


- Display numerical data in plots on a number line, including dot plots (line plots), histograms, and box plots.
- Recognize and formulate a statistical question as one that anticipates variability and can be answered with quantitative data.
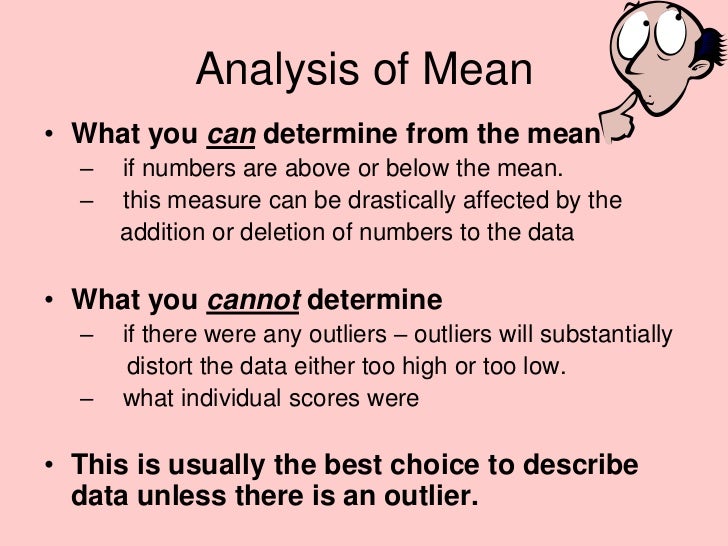
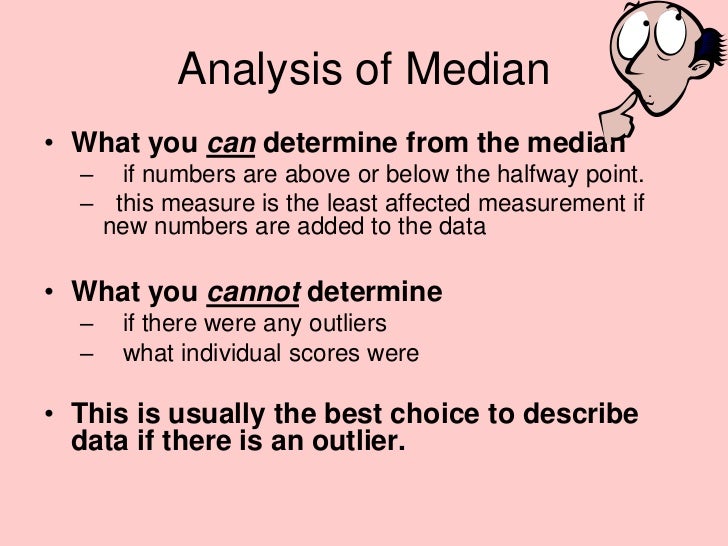
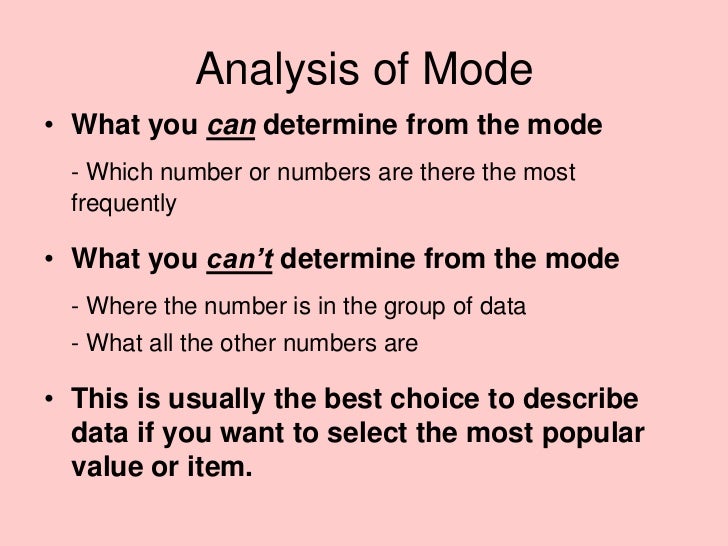
- Choose the measures of center and variability, based on the shape of the data distribution and the context in which the data were gathered.


No comments:
Post a Comment